RealtimeChart
RealtimeChart is a React component for rendering timeseries-based data in realtime chart format.
When?#
Use RealtimeChart (over TimeseriesChart) for more arbitrary form of data, you want a finer control of the updates timing.
Usage#
RealtimeChart will re-render every time you pass new values to currentTime or rows props, giving you the realtime update effect. You need to transform your data to the format that rows expects: Bucket[]
Props#
| Prop | Type | Required | Default | Description |
|---|---|---|---|---|
| width | number or string | No | '100%' | The width of the chart. If given in number, the width is set in px. If given in string, it tries to parse into %, relative to the parent element. |
| renderRow | RenderRowFunc | Yes | - | The function which formats the row. It's passed a bucket and the Row React component. Must return a JSX which is up to you to format and render as you like. |
| onClick | (MouseEvent, number) => void | No | () => {} | The function that gets triggered when user clicks on the chart. It gets reference to the MouseEvent which triggered this function, and a number representing the time within the chart (mapped by the position within the chart). |
| onFrameChange | ({ start: number, end: number }) => void | No | () => {} | Executed when the chart's timeframe changes. Timeframe changes when the chart's boundary is recaulculated and re-rendered. The start and end passed are the new timeframe's start and end time. |
| renderNoDataFallback | () => ReactElement | No | () => <div>Waiting for data...</div> | The function that returns a JSX when newBucket prop is undefined. |
| containerClass | string | No | "" | A list of HTML class names for the chart's container. |
| containerStyle | Object | No | {} | An object of React inline styles for the chart's container. |
| options | Options | No | {} | Refer to the Options section below. |
Options#
| Prop | Type | Required | Default | Description |
|---|---|---|---|---|
| frameCycle | number | No | 60000 | The length of the time frame lifecycle in milliseconds, where one time frame represents the period that chart remains with the same time range between updates. |
| rulerInterval | number | No | 5000 | The time interval between each ruler. Not applicable if hideRuler option is true. |
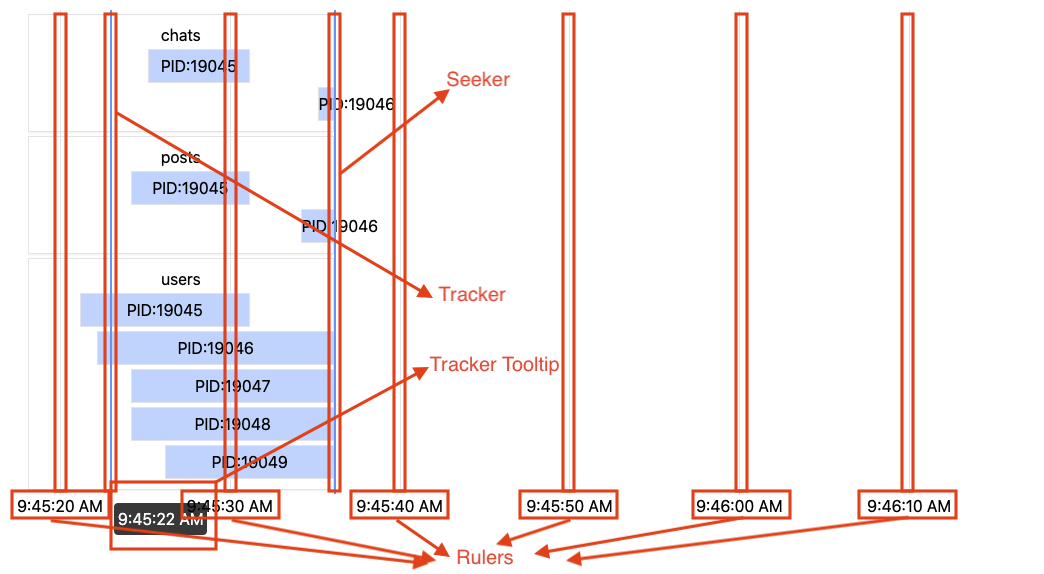
| hideRuler | boolean | No | false | If true, hide the ruler (see the image below). |
| hideSeeker | boolean | No | false | If true, hide the seeker (see the image below). |
| hideTracker | boolean | No | false | If true, hide the tracker (the vertical line which tracks the mouse position - see the image below). |
| hideTrackerTooltip | boolean | No | false | If true, hide the tooltip for the tracker. |
| formatRulerInterval | (number) => string | No | (pos: number) => "" + pos | Formats the time label shown for the rulers and tracker tooltip. |